pystrat is a python package for plotting stratigraphic sections. It was originally created by Yuem Park, who developed its 1.0 release in 2020. The initial version had the ability to plot individual sections with styling for widths and colors of stratigraphic units, as well as the plotting of measurements such as \(\delta^{13}\)C alongside sections.
The pystrat package has been extremely helpful for quick, programmatic, and reproducible plotting of the many stratigraphic sections I measured over the course of my PhD. During that time, I also added significantly more functionality to pystrat:
- USGS swatches can be plotted onto beds for more styling
- annotations can be plotted at specific heights in sections to highlight certain observations
- groups, formations, members, etc. can be labeled in sections
- fence diagrams with correlations between sections can be plotted
Examples of these new features are summarized in a couple images below:
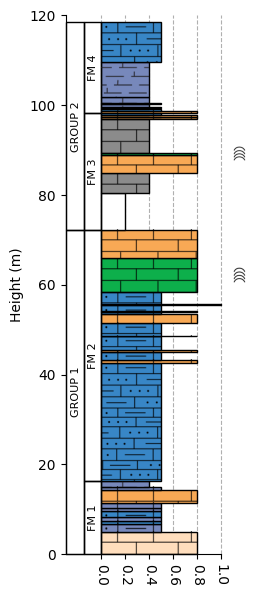
Section in pystrat with swatches, annotations, and formation labels.
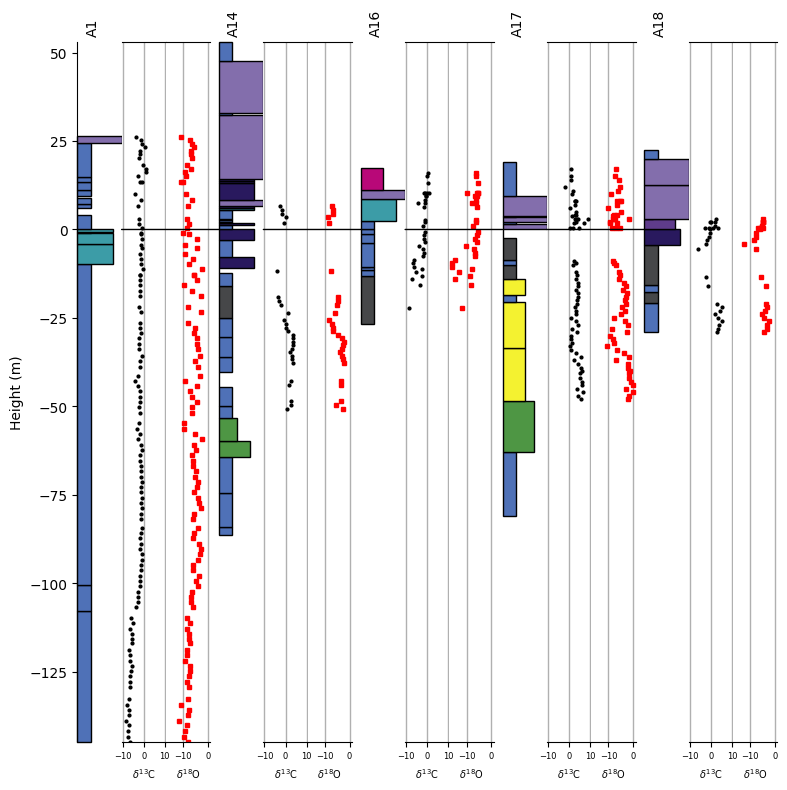
Fence diagram in pystrat with multiple proxy data plotted alongside.
I’ve also revamped the documentation for pystrat, which now has its own website complete with full API documentation as well as guided walkthroughs of the new functionality:
This work has culminated in a pystrat 2.0 release, which is now available on pypi! You can install the new version with pip:
pip install pystrat
Finally, future development of pystrat will occur through the new pystrat maintainers organization on GitHub. If you try pystrat out and want to contribute new code to the project, just fork the repository and submit a pull request with your changes.
Alternatively, feel free to raise GitHub issues if you encounter any bugs or have ideas for new features!