radage.radage module
- class radage.radage.DetritalSpectra(UPbs=None, ages=None, discordance_filtering=False, discordance_method='concordia-distance', discordance_threshold=3)[source]
Bases:
objectClass for gathering and analyzing detrital age spectra from geologic sources.
User can provide either radage.UPb objects or numerical ages, grouped by sample, locality, formation, time interval, or any other grouping of interest. If UPb objects are provided, discordance filtering can optionally be applied to the provided objects. If numerical ages are provided, then the class will assume that they have already been filtered for discordance and other quality control metrics.
- Parameters:
UPbs (dict or pandas.DataFrame, optional) – Dictionary or DataFrame of UPb objects. If dict, keys are grouping names (e.g., sample names, localities, formations, time intervals, etc.) and values are lists of radage.UPb objects. If DataFrame, must have a column called ‘UPb’ and a column called ‘Group’, and the rows correspond to individual ages. By default, None, in which cases ages must be specified.
ages (dict or pandas.DataFrame, optional) – Dictionary or DataFrame of numerical detrital zircon ages. Structure as for UPbs, but values are lists of numerical ages instead of UPb objects, and a column label ‘Age’ rather than ‘UPb’ must be present. By default, None, in which cases UPbs must be specified.
discordance_filtering (bool, optional) – Whether or not to apply discordance filtering to the provided UPb objects. If True, then the discordance method and threshold parameters will be used to filter the provided UPb objects. Ignored if numerical ages are provided. If False, then no filtering will be applied and all provided UPb objects will be used in subsequent analyses. By default, False.
discordance_method (str, optional) – Method to use for discordance filtering if discordance_filtering is True. Valid values are ‘relative’, ‘absolute’, ‘aitchison’, ‘concordia-distance’. By default, ‘concordia-distance’.
discordance_threshold (float, optional) – Threshold value for discordance filtering if discordance_filtering is True. See
discordance_filter()for more details on how the threshold is applied for each method. By default, 3.
- dissimilarity(method='wasserstein', kde_args={})[source]
Compute dissimilarity matrix between detrital age spectra.
- Parameters:
method (str, optional) – Method to compute pairwise spectra dissimilarities, by default ‘wasserstein’. Valid methods are ‘wasserstein’, ‘ks’, ‘energy-distance’, ‘jensen-shannon’. - ‘wasserstein’: Wasserstein distance between empirical age distributions. See https://docs.scipy.org/doc/scipy/reference/generated/scipy.stats.wasserstein_distance.html for more details. Recommended by: Lipp, A., and Vermeesch, P., 2023, Short communication: The Wasserstein distance as a dissimilarity metric for comparing detrital age spectra and other geological distributions: Geochronology, v. 5, p. 263–270, doi:10.5194/gchron-5-263-2023. - ‘ks’: Kolmogorov-Smirnov distance between empirical age distributions. See https://docs.scipy.org/doc/scipy/reference/generated/scipy.stats.ks_2samp.html for more details. - ‘energy-distance’: Energy distance between empirical age distributions. See https://docs.scipy.org/doc/scipy/reference/generated/scipy.stats.energy_distance.html for more details. - ‘jensen-shannon’: Jensen-Shannon distance between kernel density estimated age distributions. See kde_args below for the default kernel density estimation parameters. See https://docs.scipy.org/doc/scipy/reference/generated/scipy.spatial.distance.jensenshannon.html for more details.
kde_args (dict, optional) – Additional arguments to pass to the kernel density estimation function if method is ‘jensen-shannon’. See
helper.kde_base()for more details on the available arguments and their default values.
- Returns:
D – Square array of pairwise dissimilarities between detrital age spectra.
- Return type:
np.ndarray
- mds(D, n_components=2, random_state=0, **kwargs)[source]
Perform multidimensional scaling on a dissimilarity matrix.
- Parameters:
D (pd.DataFrame) – DataFrame of pairwise dissimilarities between detrital age spectra.
n_components (int, optional) – Number of dimensions to use for MDS embedding, by default 2.
random_state (int, optional) – Random state for MDS embedding, by default 0.
kwargs (dict, optional) – Additional arguments to pass to sklearn.manifold.MDS. See https://scikit-learn.org/stable/modules/generated/sklearn.manifold.MDS.html for more details.
- Returns:
mds_coords – DataFrame of MDS coordinates for each group.
- Return type:
pd.DataFrame
- radage.radage.Pb_mix_t(r207_206, r238_206, Pbc='SK')[source]
Solve for age given a pair of 207/206 & 238/206 isotopic ratios and a common lead model.
Given a pair of 207/206 & 238/206 isotopic ratios, this function solves for the age such that one has a lead mixing model that results in identical Stacey & Kramers’ (1975) common lead model and lower intercept concordia ages while also passing through the observed pair of ratios.
- Parameters:
- Returns:
t – Age in Myr
- Return type:
Examples
import radage
- class radage.radage.UPb(r206_238=None, r207_235=None, r207_206=None, r238_206=None, rho_207235_206238=None, rho_238206_207206=None, rho_206238_207206=None, name=None)[source]
Bases:
objectU-Pb ages based on isotopic ratios and their uncertainties.
- Inputs can be any of the following combinations of measurements:
206Pb/238U and 207Pb/235U with rho_207235_206238
206Pb/238U, 207Pb/235U, and 207Pb/206Pb with rho_207235_206238 and/or rho_206238_207206
238U/206Pb and 207Pb/206Pb with rho_238206_207206
- Parameters:
r206_238 (tuple or list) – Pb206/U238 ratio and 1-sigma absolute uncertainty, by default None. If None, the ratio is computed from r238_206.
r207_235 (tuple or list) – Pb207/U235 ratio and 1-sigma absolute uncertainty, by default None. If None, the ratio is computed from r207_206 and r206_238.
r207_206 (tuple or list) – Pb207/Pb206 ratio and 1-sigma absolute uncertainty, by default None. If None, the ratio is computed from r207_235 and r206_238.
r238_206 (tuple or list) – U238/Pb206 ratio and 1-sigma absolute uncertainty, by default None. If None, the ratio is computed from r206_238.
rho_207235_206238 (float) – Error correlation between 207/235 and 206/238 ratios. Must be between -1 and 1. By default None. If None, the correlation is computed from rho_238206_207206 or rho_206238_207206. If no correlation coefficients are provided, the default is 0.
rho_238206_207206 (float) – Error correlation between 238/206 and 207/206 ratios. Must be between -1 and 1. By default None. If None, the correlation is computed from rho_207235_206238 or rho_206238_207206. If no correlation coefficients are provided, the default is 0.
rho_206238_207206 (float) – Error correlation between 206/238 and 207/206 ratios. Must be between -1 and 1. By default None. If None, the correlation is computed from rho_207235_206238 or rho_238206_207206. If no correlation coefficients are provided, the default is 0.
name (str, optional) – Name for age, by default None. Useful for plotting
- cov_235_238
Covariance matrix for 206/238 and 207/235 ratios
- Type:
- eigval_235_238
Eigenvalues of covariance matrix for 206/238 and 207/235 ratios
- Type:
- eigvec_235_238
Eigenvectors of covariance matrix for 206/238 and 207/235 ratios
- Type:
- cov_238_207
Covariance matrix for 238/206 and 207/206 ratios
- Type:
- eigval_238_207
Eigenvalues of covariance matrix for 238/206 and 207/206 ratios
- Type:
- eigvec_238_207
Eigenvectors of covariance matrix for 238/206 and 207/206 ratios
- Type:
- date68(conf=0.95)[source]
206/238 date with uncertainty.
- Parameters:
conf (float or None, optional) – Confidence level for interval, by default 0.95. If None, only the age is returned.
- Returns:
date (float) – Date in Myr
sig (float) – Standard deviation of date
confint (float) – Confidence interval at desired confidence level
- date75(conf=0.95)[source]
207/235 date with uncertainty.
- Parameters:
conf (float or None, optional) – Confidence level for interval, by default 0.95. If None, only the age is returned.
- Returns:
date (float) – Date in Myr
sig (float) – Standard deviation of date
confint (float) – Confidence interval at desired confidence level.
- date76(conf=0.95, u238u235=137.818)[source]
207/206 date with uncertainty.
- Parameters:
- Returns:
date (float) – Date in Myr
sig (float) – Standard deviation of date
confint (float) – Confidence interval at desired confidence level.
- date_207_238_concordia()[source]
207Pb/206Pb - 206Pb/238U concordia date
The date is calculate as per Ludwig (1998), with uncertainty and MSWD.
Utilizes the error transformation for 207Pb/235U computed from 206Pb/238U and 207Pb/206Pb as per Appendix A of Ludwig (1998).
- Returns:
t (float) – Concordia date (Myr) for 207Pb/206Pb - 206Pb/238U
t_std (float) – Standard deviation of age
poc (float) – Probability of concordance.
- date_235_238_concordia()[source]
207Pb/235U - 206Pb/238U concordia date
The date is calculate as per Ludwig (1998), with uncertainty and MSWD.
- Returns:
t (float) – Concordia date (Myr) for 207Pb/235U - 206Pb/238U
t_std (float) – Standard deviation of age
poc (float) – Probability of concordance.
- discordance(method='concordia-distance')[source]
Date discordance.
Compute discordance according to a given method.
- Parameters:
method (str, optional) –
Method for computing discordance, by default ‘relative’. Valid strings are:
’SK’: mixture model with Stacey and Kramers’ (1975) common lead model
’p_238_235’: use the probability of fit from the concordia age
- ’relative’: relative age different, where the 206/238 vs 207/235 ages are
used for 206/238 ages younger than 1 Ga, and the 207/206 vs 206/238 ages are used for ages older than 1 Ga
- ’relative_68_76’: relative age difference using only the 206/238 and 206/207
ages, computed as 1-(t68/t76)
’concordia-distance’: as defined in Equation 8 of Vermeesch (2021) (see corrigendum).
- Returns:
d – discordance
- Return type:
- radage.radage.apply_corr(UPbs, f_mu, f_std)[source]
Apply correction factor to 238/206 ratios of UPb.radage objects.
- radage.radage.concordia(t)[source]
Wetherill concordia curve.
207/235 and 206/238 ratios for given times.
- Parameters:
t (array-like) – time points in Myr
- Returns:
r207_235 (array-like) – 207/235 ratios for the given times
r206_238 (array-like) – 206/238 ratios for the given times
- radage.radage.concordia_confint(t, conf=0.95)[source]
Confidence intervals on concordia.
Function giving 206/238, 207/235 ratios for bounds on confidence region around concordia at a given t Returns upper bound, then lower bound
- Parameters:
t (array-like) – time points in Myr
conf (float, optional) – confidence level for interval, defaults to 0.95
- Returns:
lower_bound (numpy.ndarray) – Lower bound of confidence interval, first column is 207/235, second column is 206/238
upper_bound (numpy.ndarray) – Upper bound of confidence interval, first column is 207/235, second column is 206/238
- radage.radage.concordia_tw(t)[source]
Tara-Wasserberg concordia curve.
238/206 and 207/206 ratios for given times.
- Parameters:
t (array-like) – time points in Myr
- Returns:
r238_206 (array-like) – 238/206 ratios for the given times
r207_206 (array-like) – 207/206 ratios for the given times
- radage.radage.discordance_filter(ages, method='concordia-distance', threshold=0.03, system_threshold=False)[source]
function to filter on discordance
- Parameters:
ages (list) – List of UPb.radage objects
method (string) – ‘relative’, ‘absolute’, ‘aitchison’, ‘concordia-distance’, by default ‘concordia-distance’ discordance metric to use. Discordance is evaluated between 207/206-238/206 ages for samples with 207/206 ages > 1 Ga, and 206/238-207/235 ages for sample with 207/206 ages < 1 Ga
threshold (float, optional) – discordance value for chosen filtering method above which to flag ages as discordant
system_threshold (boolean, optional) – whether or not to switch discordance metrics between the 207/206-238/206 and 206/238-207/235 systems at 1 Ga. If false, then discordance is always computed between the 207/206-238/206 systems. If true, only works for aitchison, relative, and absolute discordance metrics.
- Returns:
ages_conc (list) – List of UPb.radage objects that pass the discordance filter
idx (np.ndarray) – Indices of the ages that pass the discordance filter
- radage.radage.discordia_date_76_86(UPbs, conf=None, n_mc=500, Pbc=None, Pbc_std=0.01, Vx=None, Vy=None, Vxy=None)[source]
Lower intercept date in Tera-Wasserburg space
- Parameters:
UPbs (list) – List of UPb.radage objects
conf (float, optional) – Confidence level for interval, by default None. If None, only the lower intercept date is returned. Otherwise, a range corresponding to the confidence level is returned. Valid values are between 0 and 1.
n_mc (int, optional) – Number of Monte Carlo iterations to use for estimating uncertainty, by default 1000. This is only used if conf is not None.
Pbc (float, optional) – Common lead ratio to use, by default None. If None, the common lead ratio is estimated from the data. If a float, the common lead ratio is fixed to this value. If ‘SK’, the common lead ratio is determined such that it is equal to the Stacey and Kramers (1975) common lead ratio at the lower intercept date.
Pbc_std (float, optional) – Standard deviation of the common lead ratio, by default 1e-1. This is only used if conf is not None.
Vx (numpy.ndarray or None, optional) – 2D array of 238/206 covariance. Diagonal elements correspond to 238/206 uncertainties for each UPb object. Offdiagonal elements will be non-zero for 238/206 measurements that share a common, uncertain correction, like for carbonate analyses. Must have shape (len(UPbs), len(UPbs)). If specified, supercedes the values within each UPb object. If None, then the 238/206 uncertainties within each UPb object will be used.
Vy (numpy.ndarray or None, optional) – 2D array of 207/206 covariance. Diagonal elements correspond to 207/206 uncertainties for each UPb object. Offdiagonal elements will be non-zero for 207/206 measurements that share a common, uncertain correction. Must have shape (len(UPbs), len(UPbs)). If specified, supercedes the values within each UPb object. If None, then the 207/206 uncertainties within each UPb object will be used.
Vxy (numpy.ndarray or None, optional) – 2D array of cross-covariance between 238/206 and 207/206. The diagonal elements correspond to the rho_238206_207206 error correlation terms within each UPb object. Off-diagonal elements will be non-zero for 238/206 and 207/206 measurements that share a common, uncertain correction. Must have shape (len(UPbs), len(UPbs)). If specified, supercedes the values within each UPb object.
- Returns:
result – Dictionary containing the following:
- datefloat
Date in Ma corresponding to the lower intercept of the line in Tera-Wasserburg space.
- slopefloat
Slope of the line in Tera-Wasserburg space.
- slope_stdfloat
Standard deviation of the slope.
- interceptfloat
Common lead ratio determined in the calculation. Returns same value as input if Pbc is a float.
- intercept_stdfloat
Standard deviation of the common lead ratio.
- slope_intercept_covfloat
Covariance between the slope and intercept.
- x_barfloat
Mean of the resulting 238/206 ratio after fitting.
- mswdfloat
Mean square weighted deviation of the fit.
- confintlist
List of lower and upper bounds of the confidence interval for the lower intercept date. This is only computed if conf is not None.
- Return type:
- radage.radage.eHf(Hf176Hf177, Lu176Hf177, t, Hf_CHUR=0.282772, Lu_CHUR=0.0332)[source]
epsilon hafnium
for a given set of ratios
- Parameters:
Hf176Hf177 (array-like) – 176Hf/177Hf ratio(s)
Lu176Hf177 (array-like) – 176Lu/177Hf ratio(s)
t (array-like) – age(s) in Myr. If float, then the same age is used for all ratios.
Hf_CHUR (float, optional) – 176Hf/177Hf ratio for CHUR, by default Hf_CHUR
Lu_CHUR (float, optional) – 176Lu/177Hf ratio for CHUR, by default Lu_CHUR
- Returns:
eHf – epsilon hafnium value(s)
- Return type:
array-like
- radage.radage.eHf_DM(t)[source]
epsilon Hafnium for depleted mantle
- Parameters:
t (array-like) – Age(s) in Myr
- Returns:
eHf – epsilon hafnium value(s) for depleted mantle
- Return type:
array-like
- radage.radage.get_ages(df, combination='Wetherill', uncertainty_type='2 sigma absolute', columns=None)[source]
Produce UPb age objects
Create UPb age objects from dataframe. This function assumes that one of the following combinations of input quantites is available in the dataframe. These inputs should have with matching column names and columns in a hierarchical index, with the second level of the index being either ‘mean’ or ‘uncertainty’. If correlation coefficients (rho) are not available, then they will be set to zero. Wetherill: - r206_238 - r207_235 - rho_207235_206238 All: - r206_238 - r207_235 - r207_206 - rho_207235_206238 - rho_206238_207206 TW: - r238_206 - r207_206 - rho_238206_207206
- Parameters:
df (pd.DataFrame) – DataFrame of U-Pb measurements, ideally from GeochemDB.GeochemDB.measurements_by_sample(). Assumes a hierarchical column index with levels matching the columns described above. Each level should have ‘mean’ and ‘uncertainty’ sublevels, except for the correlation coefficients, which should only have a ‘mean’ sublevel.
combination (str, optional) – Combination of input quantities to use for creating UPb objects, by default ‘Wetherill’. Valid options are ‘Wetherill’, ‘All’, and ‘TW’.
uncertainty_type (str, optional) – Type of uncertainty to use for creating UPb objects, by default ‘2 sigma absolute’. Valid options are ‘2 sigma absolute’, ‘1 sigma absolute’, ‘2 sigma relative’, and ‘1 sigma relative’. This parameter determines how the uncertainties in the dataframe are interpreted when creating the UPb objects.
columns (dictionary, optional) – Dictionary with mapping of column names in the case the dataframe columns do not match the names above. The expected structure is {actual_name: default_name} (e.g., {‘Pb206_U238’: ‘r206_238’}). Only applies to the top level in the multiindex (i.e., the second level should still be ‘mean’ and ‘uncertainty’), and the input dataframe is expected to have a multiindex in the columns. If None, the function will use the default column names as described above.
- Returns:
ages – List of UPb objects.
- Return type:
- radage.radage.kde(radages, t, kernel='gauss', bw='adaptive', weights='uncertainty', **kwargs)[source]
Evaluate kde for radages at times t.
The 238/206 - 207/206 concordia ages are used for plotting, and the associated uncertainties are used as weights.
- Parameters:
radages (arraylike) – list of radages.
t (arraylike) – times at which to evaluate the kde.
bw (str or float, optional) – Bandwidth, by default ‘adaptive’. Valid strings are ‘adaptive’, ‘scott’, ‘botev’. If float, specifies a fixed bandwidth directly.
kernel (str, optional) – Kernel function to use, by default ‘epa’. Valid strings are ‘epa’, ‘gauss’.
weights (arraylike or None or str, optional) – Weights for each age, by default ‘uncertainty’. Valid values are ‘uncertainty’, None, or an array of floats of the same length as radages.
**kwargs (dict, optional) – Additional arguments to pass to helper.kde_base
- Returns:
kde_est – KDE estimate at times t
- Return type:
arraylike
- radage.radage.line_mc_76_86(m, b, m_std, b_std, m_b_cov, N=1000)[source]
Sample isochrons in Tera-Wasserburg space
- Parameters:
m (float) – Slope of the line in Tera-Wasserburg space
b (float) – Intercept of the line in Tera-Wasserburg space
m_std (float) – Standard deviation of the slope
b_std (float) – Standard deviation of the intercept
m_b_cov (float) – Covariance between the slope and intercept
N (int, optional) – Number of samples to draw, by default 1000
- Returns:
m (array) – Array of length N with sampled slopes.
b (array) – Array of length N with sampled intercepts.
- radage.radage.line_mswd_york(m, b, x, y, wx, wy, r)[source]
Reduced chi-squared statistic for a linear fit to data with errors in both x and y.
From section V. in York et al. 2004
- Parameters:
m (float) – Slope of line
b (float) – Intercept of line
x (array-like) – x-values
y (array-like) – y-values
wx (array-like) – Weights for x-values (typically 1/sigma^2)
wy (array-like) – Weights for y-values (typically 1/sigma^2)
r (array-like) – Correlation coefficients of errors in x and y, must be between -1 and 1
- Returns:
mswd – Reduced chi-squared statistic for residuals with respect to the line
- Return type:
- radage.radage.lower_intercept_76_86(m, b, x0=1000)[source]
Find the lower intercept date in Tera-Wasserburg space
- radage.radage.ogls_line_fit(x, y, Vx, Vy, Vxy, m0=-1, b0=1)[source]
Omnivariant Generalized Least Squares (for line fitting)
Protocol from Daëron & Vermeesch 2024 for fitting a linear model to data with correlated errors within and across analyses.
- Parameters:
x (array-like) – Mean x-values, length N
y (array-like) – Mean y-values, length N
Vx (array-like) – Covariance matrix for x-values, NxN
Vy (array-like) – Covariance matrix for y-values, NxN
Vxy (array-like) – Covariance matrix for x and y values, NxN. Diagonal corresponds to correlation between x and y for each analysis, as used in York Fit. Unlike Daëron & Vermeesch 2024, this implementation uses Vxy, not Vyx, so x increments in rows, and y increments in columns
m0 (float) – Initial guess for slope, by default -1.
b0 (float) – Initial guess for y-intercept, by default 1.
- radage.radage.r206_238(t)[source]
206/238 ratio for given time.
- Parameters:
t (float or numpy.ndarray) – Time in Myr
- Returns:
r206_238 – 206/238 ratio for the given time(s)
- Return type:
- radage.radage.r207_206(t, u238u235=137.818)[source]
207/206 ratio for given time.
- Parameters:
t (float or numpy.ndarray) – Time in Myr
u238u235 (float, optional) – Ratio of U238 to U235, by default 138.818
- Returns:
r207_206 – 207/206 ratio for the given time(s)
- Return type:
- radage.radage.r207_235(t)[source]
207/235 ratio for given time.
- Parameters:
t (float or numpy.ndarray) – Time in Myr
- Returns:
r207_235 – 207/235 ratio for the given time(s)
- Return type:
- radage.radage.rho206238_207206_to_rho207235_206238(r206238, r206238_std, r207206, r207206_std, rho_206238_207206)[source]
convert error correlation from 206-238 vs 207-206 to 207-2235 vs 206-238
see pg. 174 of notes (Red Leuchtturm)
- Parameters:
- Returns:
rho207235_206238 (float or array) – error correlation coefficients for 207-235 vs 206-238 The negative of this correlation coefficient is the correlation coefficient for 206-238 vs 207-206 (see page 173 Leuchtturm notebook)
r206238_std (float or array) – 206-238 uncertainties
r207235_std (float or array) – 207-235 uncertainties
- radage.radage.rho207235_206238_to_rho238206_207206(r207235, r207235_std, r206238, r206238_std, rho_207235_206238)[source]
convert error correlation from 206-238 vs 207-235 to 207-206 vs 238-206
see pg. 170-1 of notes (Red Leuchtturm)
- Parameters:
- Returns:
rho207206_238206 (float or array) – error correlation coefficients for 207-206 vs 238-206 The negative of this correlation coefficient is the correlation coefficient for 206-238 vs 207-206 (see page 173 Leuchtturm notebook)
r238206_std (float or array) – 238-206 uncertainties
r207206_std (float or array) – 207-206 uncertainties
- radage.radage.root_fun_76_86(r238_206, m, b)[source]
Root function for finding the lower intercept date in Tera-Wasserburg space :param r238_206: 238/206 ratio :type r238_206: float :param m: Slope of the line in Tera-Wasserburg space :type m: float :param b: Intercept of the line in Tera-Wasserburg space :type b: float
- Returns:
r207_206_conc - r207_206_disc – Difference between the concordia and discordia ratios
- Return type:
- radage.radage.sk_misfit(t, r238_206, r207_206, method='207/206', **sk_params)[source]
Misfit between observed 238/206 and 207/206 ratios and the Stacey and Kramers (1975) common lead model at a given age.
- Parameters:
t (float) – Age (in Ma) for which to compute the misfit.
r238_206 (float or array) – Observed 238/206 ratio(s).
r207_206 (float or array) – Observed 207/206 ratio(s).
method (str, optional) –
Method for computing the misfit, by default ‘207/206’. Valid options are:
’207/206’: misfit is computed as the difference between observed and model 207/206 ratios (at given 238/206).
’238/206’: misfit is computed as the difference between observed and model 238/206 ratios (at given 207/206).
’orth’: misfit is computed as shortest distance between the observed 238/206, 207/206 point and the Stacey and Kramers model curve.
sk_params (dict) – Additional parameters to pass to the sk_pb function, such as t0, t1, mu1, mu2, x0, y0.
- Returns:
misfit – Misfit value(s) between observed ratios and the Stacey and Kramers (1975) model at age t.
- Return type:
float or array
- radage.radage.sk_pb(t, t0=4570.0, t1=3700.0, mu1=7.19, mu2=9.74, x0=9.307, y0=10.294)[source]
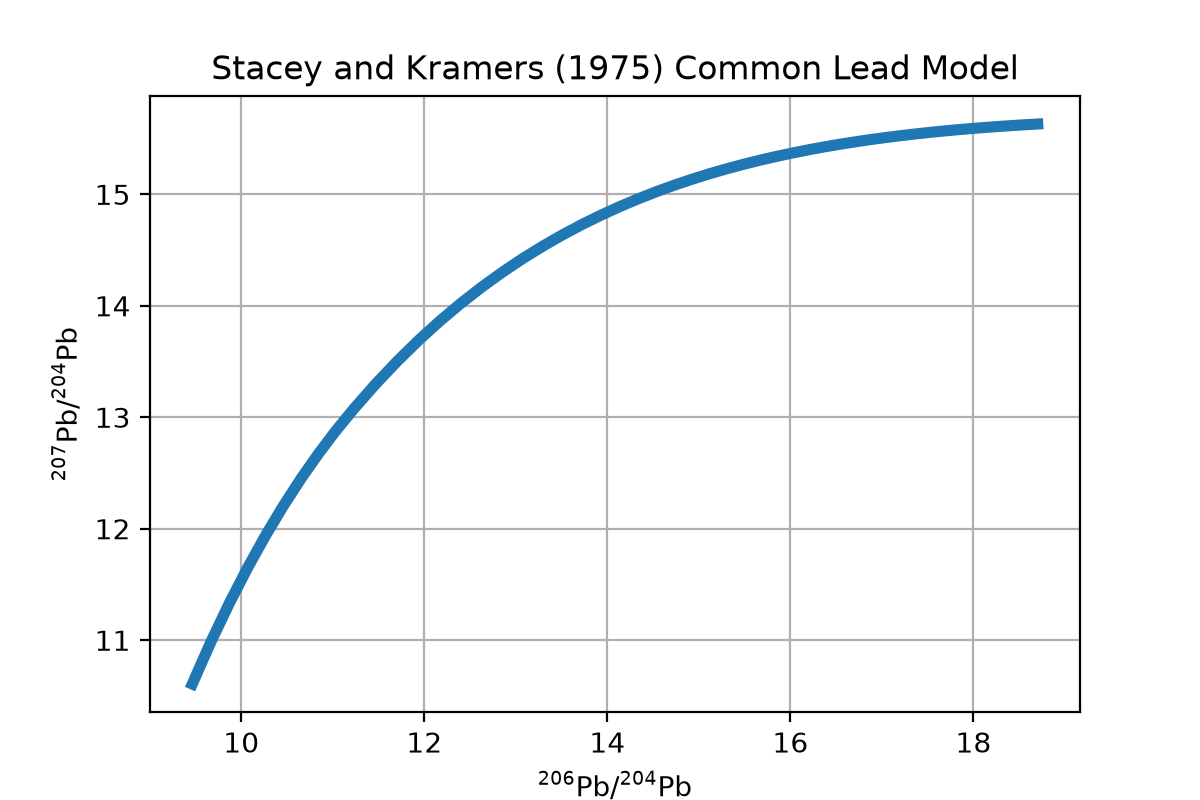
Common lead model from Stacey and Kramers (1975).
This model implements a two stage process for the evolution of common lead.
For times before \(t_1 = 3.7\) Ga, the following equations describe the temporal evolution of common lead:
\[\begin{split}\begin{align} \frac{^{206}\text{Pb}}{^{204}\text{Pb}}(t) &= \left(\frac{^{206}\text{Pb}}{^{204}\text{Pb}}\right)_0 + \mu_1\,\left(e^{\lambda_{238}t_0}-e^{\lambda_{238}t}\right) \\ \frac{^{207}\text{Pb}}{^{204}\text{Pb}}(t) &= \left(\frac{^{207}\text{Pb}}{^{204}\text{Pb}}\right)_0 + \frac{^{235}\text{U}}{^{238}\text{U}} \, \mu_1\, \left(e^{\lambda_{235}t_0}-e^{\lambda_{235}t}\right) \end{align}\end{split}\]For times after \(t_1 = 3.7\) Ga, the following equations describe the temporal evolution of common lead:
\[\begin{split}\begin{align} \frac{^{206}\text{Pb}}{^{204}\text{Pb}}(t) &= \left(\frac{^{206}\text{Pb}}{^{204}\text{Pb}}\right)_1 + \mu_2\,\left(e^{\lambda_{238}t_1}-e^{\lambda_{238}t}\right) \\ \frac{^{207}\text{Pb}}{^{204}\text{Pb}}(t) &= \left(\frac{^{207}\text{Pb}}{^{204}\text{Pb}}\right)_1 + \frac{^{235}\text{U}}{^{238}\text{U}} \, \mu_2\, \left(e^{\lambda_{235}t_1}-e^{\lambda_{235}t}\right) \end{align}\end{split}\]where \(\left(\frac{^{206}\text{Pb}}{^{204}\text{Pb}}\right)_1\) and \(\left(\frac{^{207}\text{Pb}}{^{204}\text{Pb}}\right)_1\) are the above equations evaluated at \(t=t_1\).
- Parameters:
t (1d array like) – Time(s) (in Ma) for which to return isotopic ratios for the linear mixing model from concordia to mantle
t0 (float, optional) – Age of earth in Myr, by default 4570.
t1 (float, optional) – Age of transition between model stages, by default 3700.
mu1 (float, optional)
mu2 (float, optional)
x0 (float, optional) – 206Pb/204Pb ratio for troilite lead, by default 9.307.
y0 (float, optional) – 207Pb/204Pb ratio for troilite lead, by default 10.294.
- Returns:
r206_204 (1d array) – 206/204 ratio(s) for the given time(s)
r207_204 (1d array) – 207/204 ratio(s) for the given time(s)
Examples
import radage
import numpy as np
import matplotlib.pyplot as plt
t = np.linspace(0, 4500, 50)
r206_204, r207_204 = radage.sk_pb(t)
plt.figure(figsize=(6, 4))
plt.plot(r206_204, r207_204, linewidth=4)
plt.grid()
plt.xlabel(r'${}^{206}\mathrm{Pb}/{}^{204}\mathrm{Pb}$')
plt.ylabel(r'${}^{207}\mathrm{Pb}/{}^{204}\mathrm{Pb}$')
plt.title('Stacey and Kramers (1975) Common Lead Model')
plt.show()
(
Source code,png,hires.png,pdf)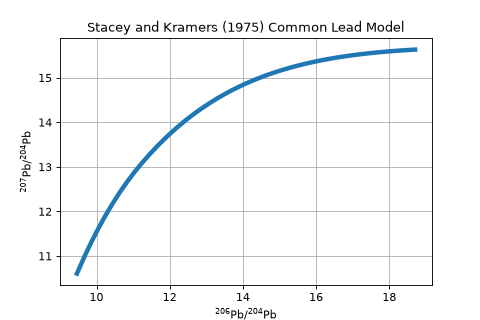
- radage.radage.t207(r207_206, u238u235=137.818)[source]
207/206 date
- Parameters:
r207_206 (float or numpy.ndarray) – 207/206 ratio(s)
u238u235 (float, optional) – Ratio of U238 to U235, by default u238u235
- Returns:
date – Date in Myr
- Return type:
- radage.radage.t235(r207_235)[source]
207/235 date
- Parameters:
r207_235 (float or numpy.ndarray) – 207/235 ratio
- Returns:
t – Date in Myr
- Return type:
- radage.radage.t238(r206_238)[source]
206/238 date
- Parameters:
r206_238 (float or numpy.ndarray) – 206/238 ratio
- Returns:
t – Date in Myr
- Return type:
- radage.radage.uncertainty_ellipse(x, y, x_std, y_std, rho, conf=0.95, patch_dict=None)[source]
Uncertainty ellipse for correlated data.
- Parameters:
x (float) – x-coordinate of center of ellipse
y (float) – y-coordinate of center of ellipse
x_std (float) – standard deviation in x
y_std (float) – standard deviation in y
rho (float) – correlation coefficient between x and y
conf (float, optional) – confidence level, by default 0.95
patch_dict (dict, optional) – dictionary of properties for the ellipse patch, by default None
- Returns:
ell – Ellipse object representing the uncertainty ellipse for the given data.
- Return type:
- radage.radage.wc1_corr(wc1_UPbs, N=1000)[source]
Generate correction factor for 238/206 ratios of WC1 analyses.
Let X1 be a random variable representing the 238/206 ratio of the lower intercept for the data fit to the provided WC1 analyses. Let X2 be the random variable representing the 238/206 ratio of the lower intercept reported by Roberts et al. (2017) for the WC1 analyses. The correction factor f is then defined as f = X2 / X1. This function estimates the correction factor f via Monte Carlo sampling.
- Parameters:
- Returns:
f_mu (float) – Mean of factor by which to correct 238/206 ratios.
f_std (float) – Standard deviation of factor by which to correct 238/206 ratios.
- radage.radage.weighted_mean(ages, ages_s, sig_method='naive', standard_error=True)[source]
Weighted-mean age computation
- Parameters:
ages (array-like) – Age means
ages_s (array-like) – Age standard deviations (same length as ages)
sig_method (str, optional) –
Method for computing the standard error of the weighted mean, by default ‘naive’. Valid strings are ‘naive’, ‘unbiased’ For unbiased, see
standard_error (bool, optional) – Whether to return the standard error of the weighted mean, by default True. If sig_method is ‘naive’, then this parameter is True.
- Returns:
mu (float) – Weighted mean age
sig (float) – Standard deviation or error of weighted mean age, depending on standard_error value
mswd (float) – Reduced chi-squared statistic for residuals with respect to the weighted mean
- radage.radage.yorkfit(x, y, wx, wy, r, thres=0.001)[source]
Implementation of York 1969 10.1016/S0012-821X(68)80059-7
- Parameters:
x (array-like) – Mean x-values
y (array-like) – Mean y-values
wx (array-like) – Weights for x-values (typically 1/sigma^2)
wy (array-like) – Weights for y-values (typically 1/sigma^2)
r (array-like) – Correlation coefficients of errors in x and y, must be between -1 and 1
- Returns:
b (float) – Maximum likelihood estimate for slope of line
a (float) – Maximum likelihood estimate for intercept of line
b_sig (float) – Standard deviation of slope for line
a_sig (float) – Standard deviation of intercept for line
mswd (float) – Reduced chi-squared statistic for residuals with respect to the maximum likelihood linear model
ab_cov (float) – Covariance of slope and intercept for line